Assessing Meadow Carbon Cycling Using Digital Repeat Photography and Eddy Covariance Techniques

Abstract
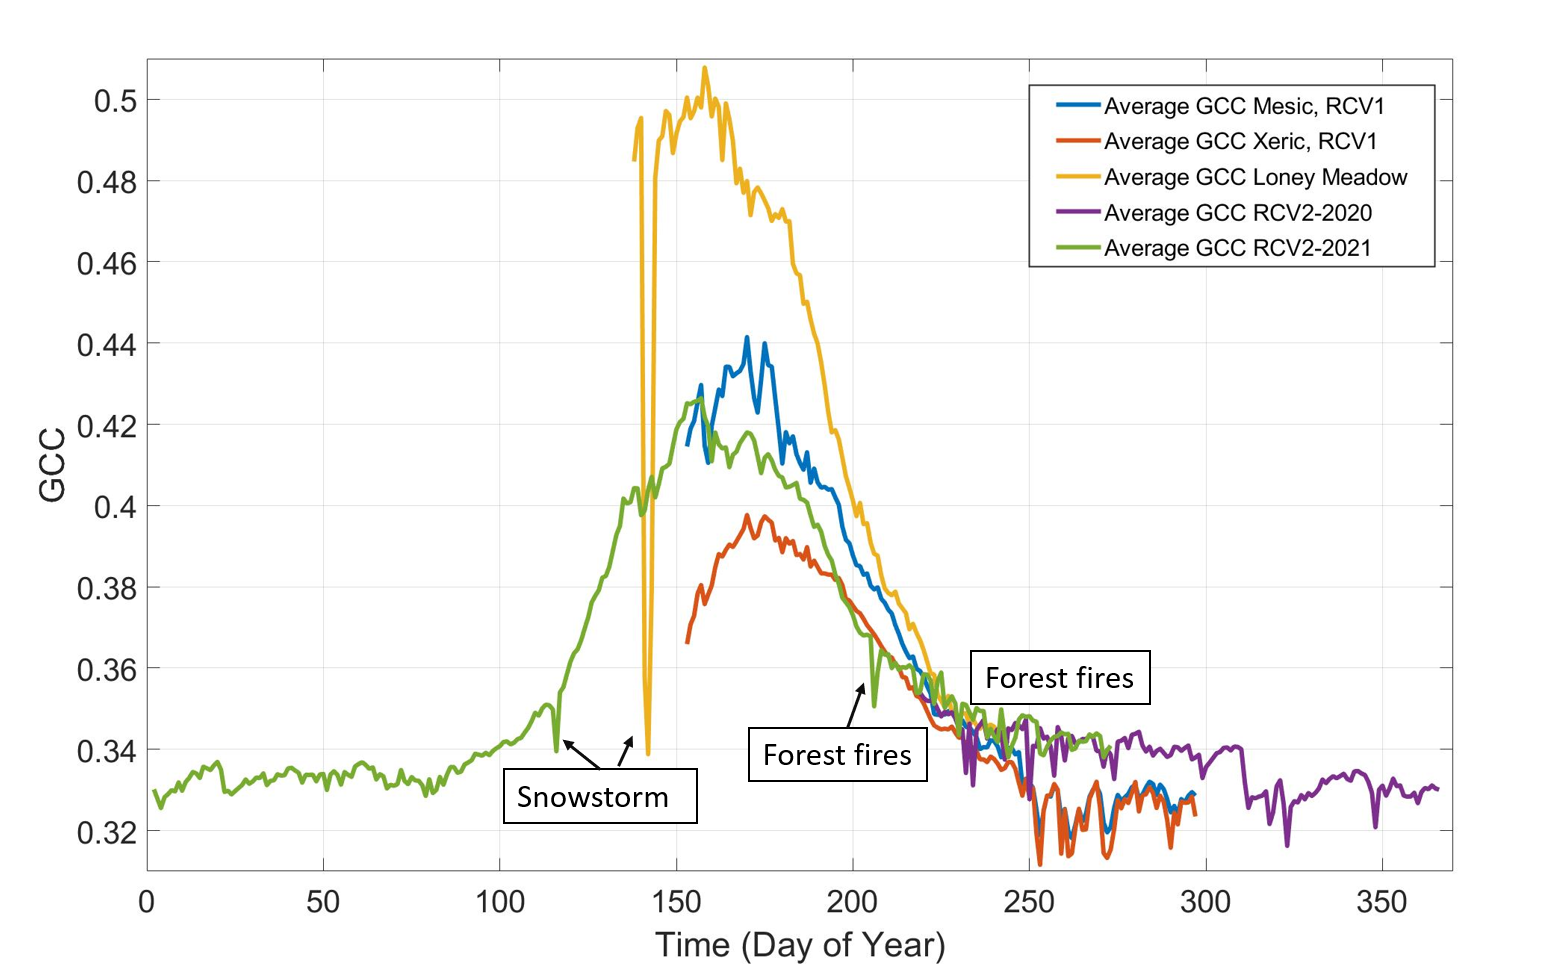
Montane meadows of Sierra Nevada have strong seasonality in plant phenology and plant water availability which has a direct impact on the duration of the growing season and the carbon cycle of this ecosystem. Significant progress has been made recently linking phenological observations using digital repeat photography to carbon cycle rates for a variety of ecosystems. We used green chromatic coordinate (GCC), an algebraic combination of red, green and blue color channels to represent vegetation photosynthetic potential. We compared GCC with daily total carbon fluxes derived from eddy covariance (EC) observations for two meadows over different growing seasons. At a seasonal timescale, GCC closely matched the EC-derived carbon exchanges, with both datasets reflecting the phenological cycle of the ecosystem in detail. Based on these relationships, we derived empirical models for different carbon fluxes and different meadow-seasons. Model performance varied between fluxes and meadows and phenological stages but shows promising results, with an R2 value of 0.74 for modeled versus observed daily gross primary production (Nash Sutcliffe model efficiency coefficient ((NS-MEC) =0.74). The model for net ecosystem production was more consistent between meadow-years with an overall model R2=0.91, NS-MEC=0.91.