Application of a new shore-based vessel traffic monitoring system within San Francisco Bay
Cope S, Hines E, Bland R, Davis JD, Tougher B, Zetterlind V (2020). Application of a new shore-based vessel traffic monitoring system within San Francisco Bay. Frontiers in Marine Science 7: article 86: 1-13.
Vessel traffic management systems can be employed for environmental management
where vessel activity may be of concern. One such location is in San Francisco Bay
where a variety of vessel types transit a highly developed urban estuary. We analyzed
vessel presence and speed across space and time using vessel data from the Marine
Monitor, a vessel tracking system that integrates data from the Automatic Identification
System and a marine-radar sensor linked to a high-definition camera. In doing so, we
provide data that can inform collision risk to cetaceans who show an increased presence
in the Bay and evaluation of the value in incorporating data from multiple sources when
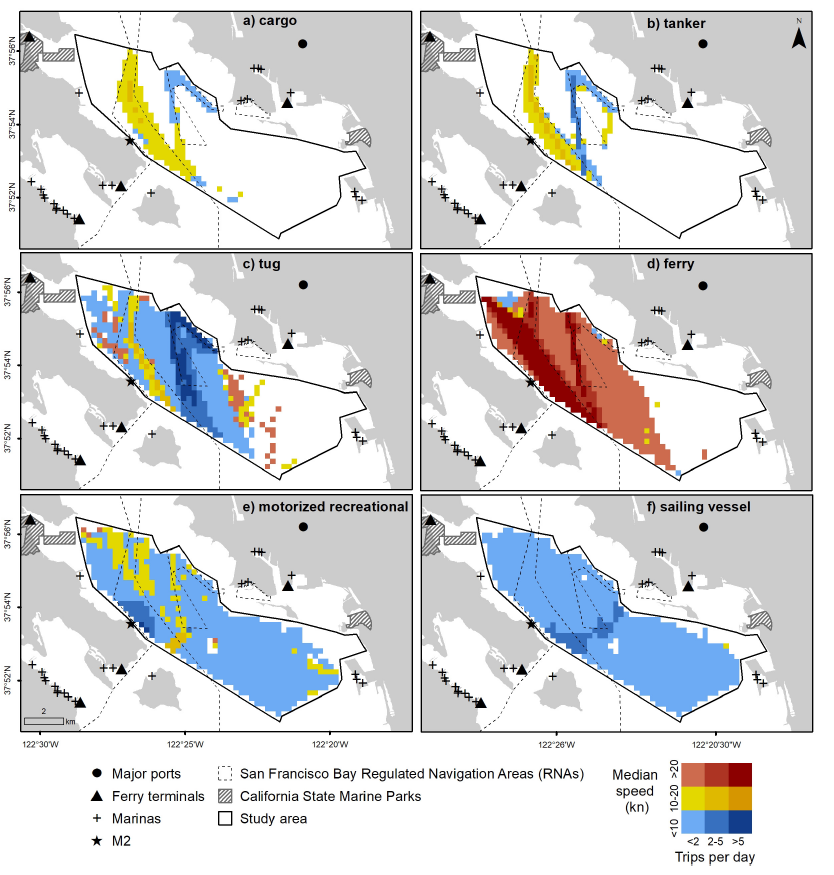
observing vessel traffic. We found that ferries traveled the greatest distance of any
vessel type. Ferries and other commercial vessels (e.g., cargo and tanker ships and
tug boats) traveled consistently in distinct paths while recreational traffic (e.g., motorized
recreational craft and sailing vessels) was more dispersed. Large shipping vessels often
traveled at speeds greater than 10 kn when transiting the study area, and ferries traveled
at speeds greater than 30 kn. We found that distance traveled and speed varied by
season for tugs, motorized recreational and sailing vessels. Distance traveled varied
across day and night for cargo ships, tugs, and ferries while speed varied between day
and night only for ferries. Between weekdays and weekends, distance traveled varied
for cargo ships, ferries, and sailing vessels, while speed varied for ferries, motorized
recreational craft, and sailing vessels. Radar-detected vessel traffic accounted for 33.9%
of the total track distance observed, highlighting the need to include data from multiple
vessel tracking systems to fully assess and manage vessel traffic in a densely populated
urban estuary.